Module 9 - Using / Interacting with the OS6 Software
System Information
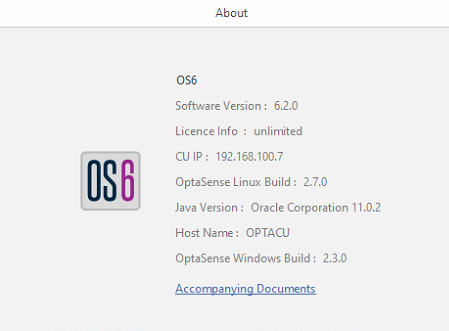
The system information tab displays details relating to important components and version numbers that make up the system.
To access this window, select About from the System tab on the toolbar.
Live Analysis
Live Alerts
Once an activity has been detected, localised and classified, an OS6 alert will be created with details of the event (time, location, importance/level, type etc.).
All alerts will be displayed on associated fibre on the Map Overview, and displayed in Alert Lists
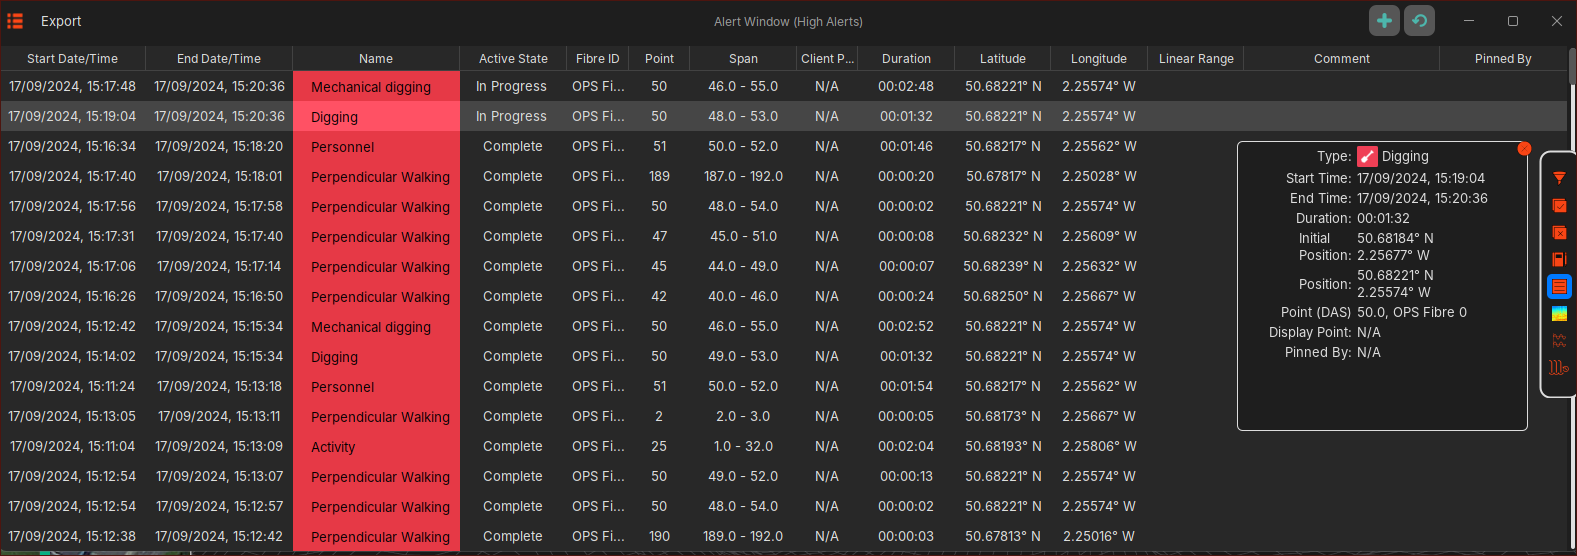
It is possible to export this (Live) Alert list
Live Waterfall
The Live Waterfall display enables users to view live acoustic sensor data in graphical format. Activities, as they occur, can be observed through the display, and tools can be used to analyse their source in greater detail.
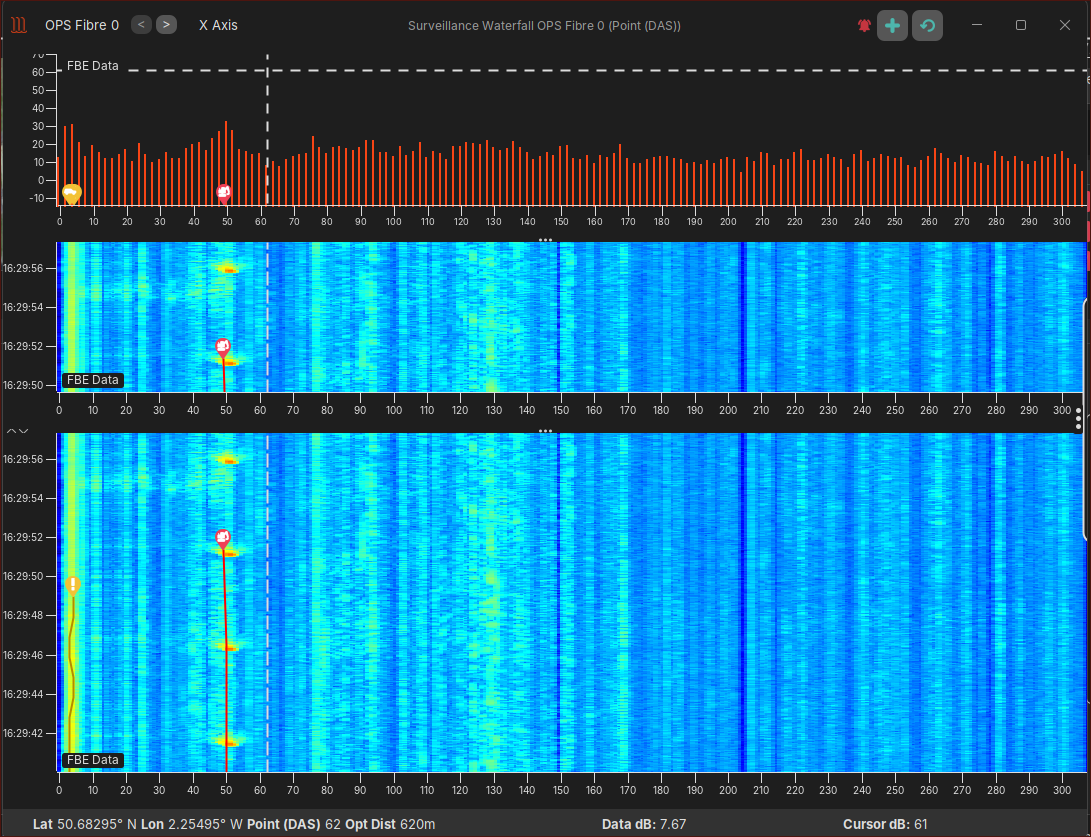
These alerts can be exported into a chart or CSV format.
Live Frequency Analysis window
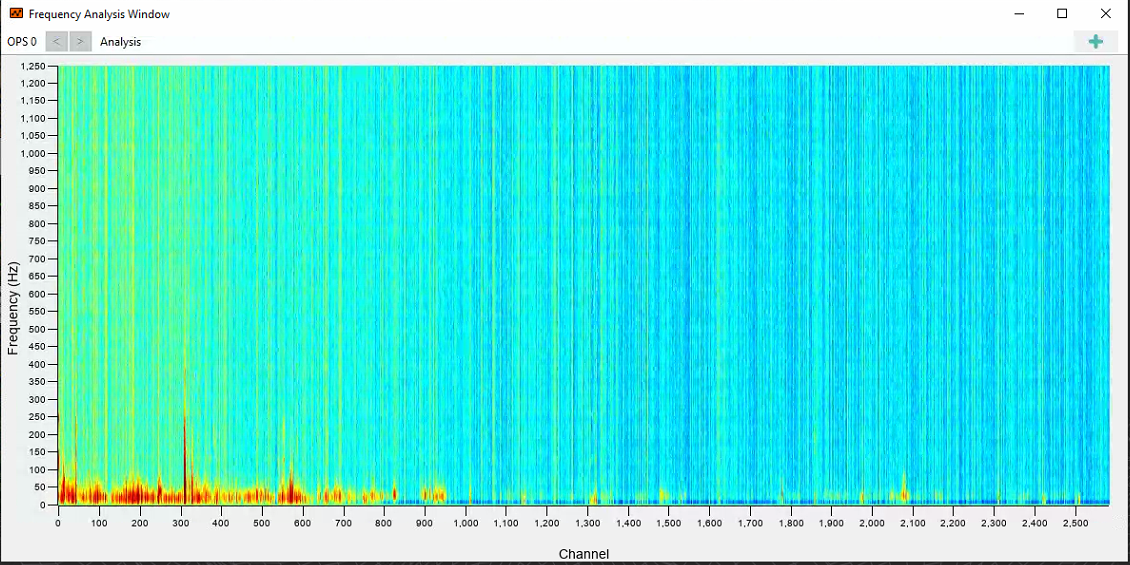
The Frequency Analysis window enables the user to carry out frequency analysis on the live waterfall. To access this feature, from the toolbar select Live Analysis and then Frequency analysis.
The frequency analysis panel displays fibre channels in the x-axis and frequency in the y axis.
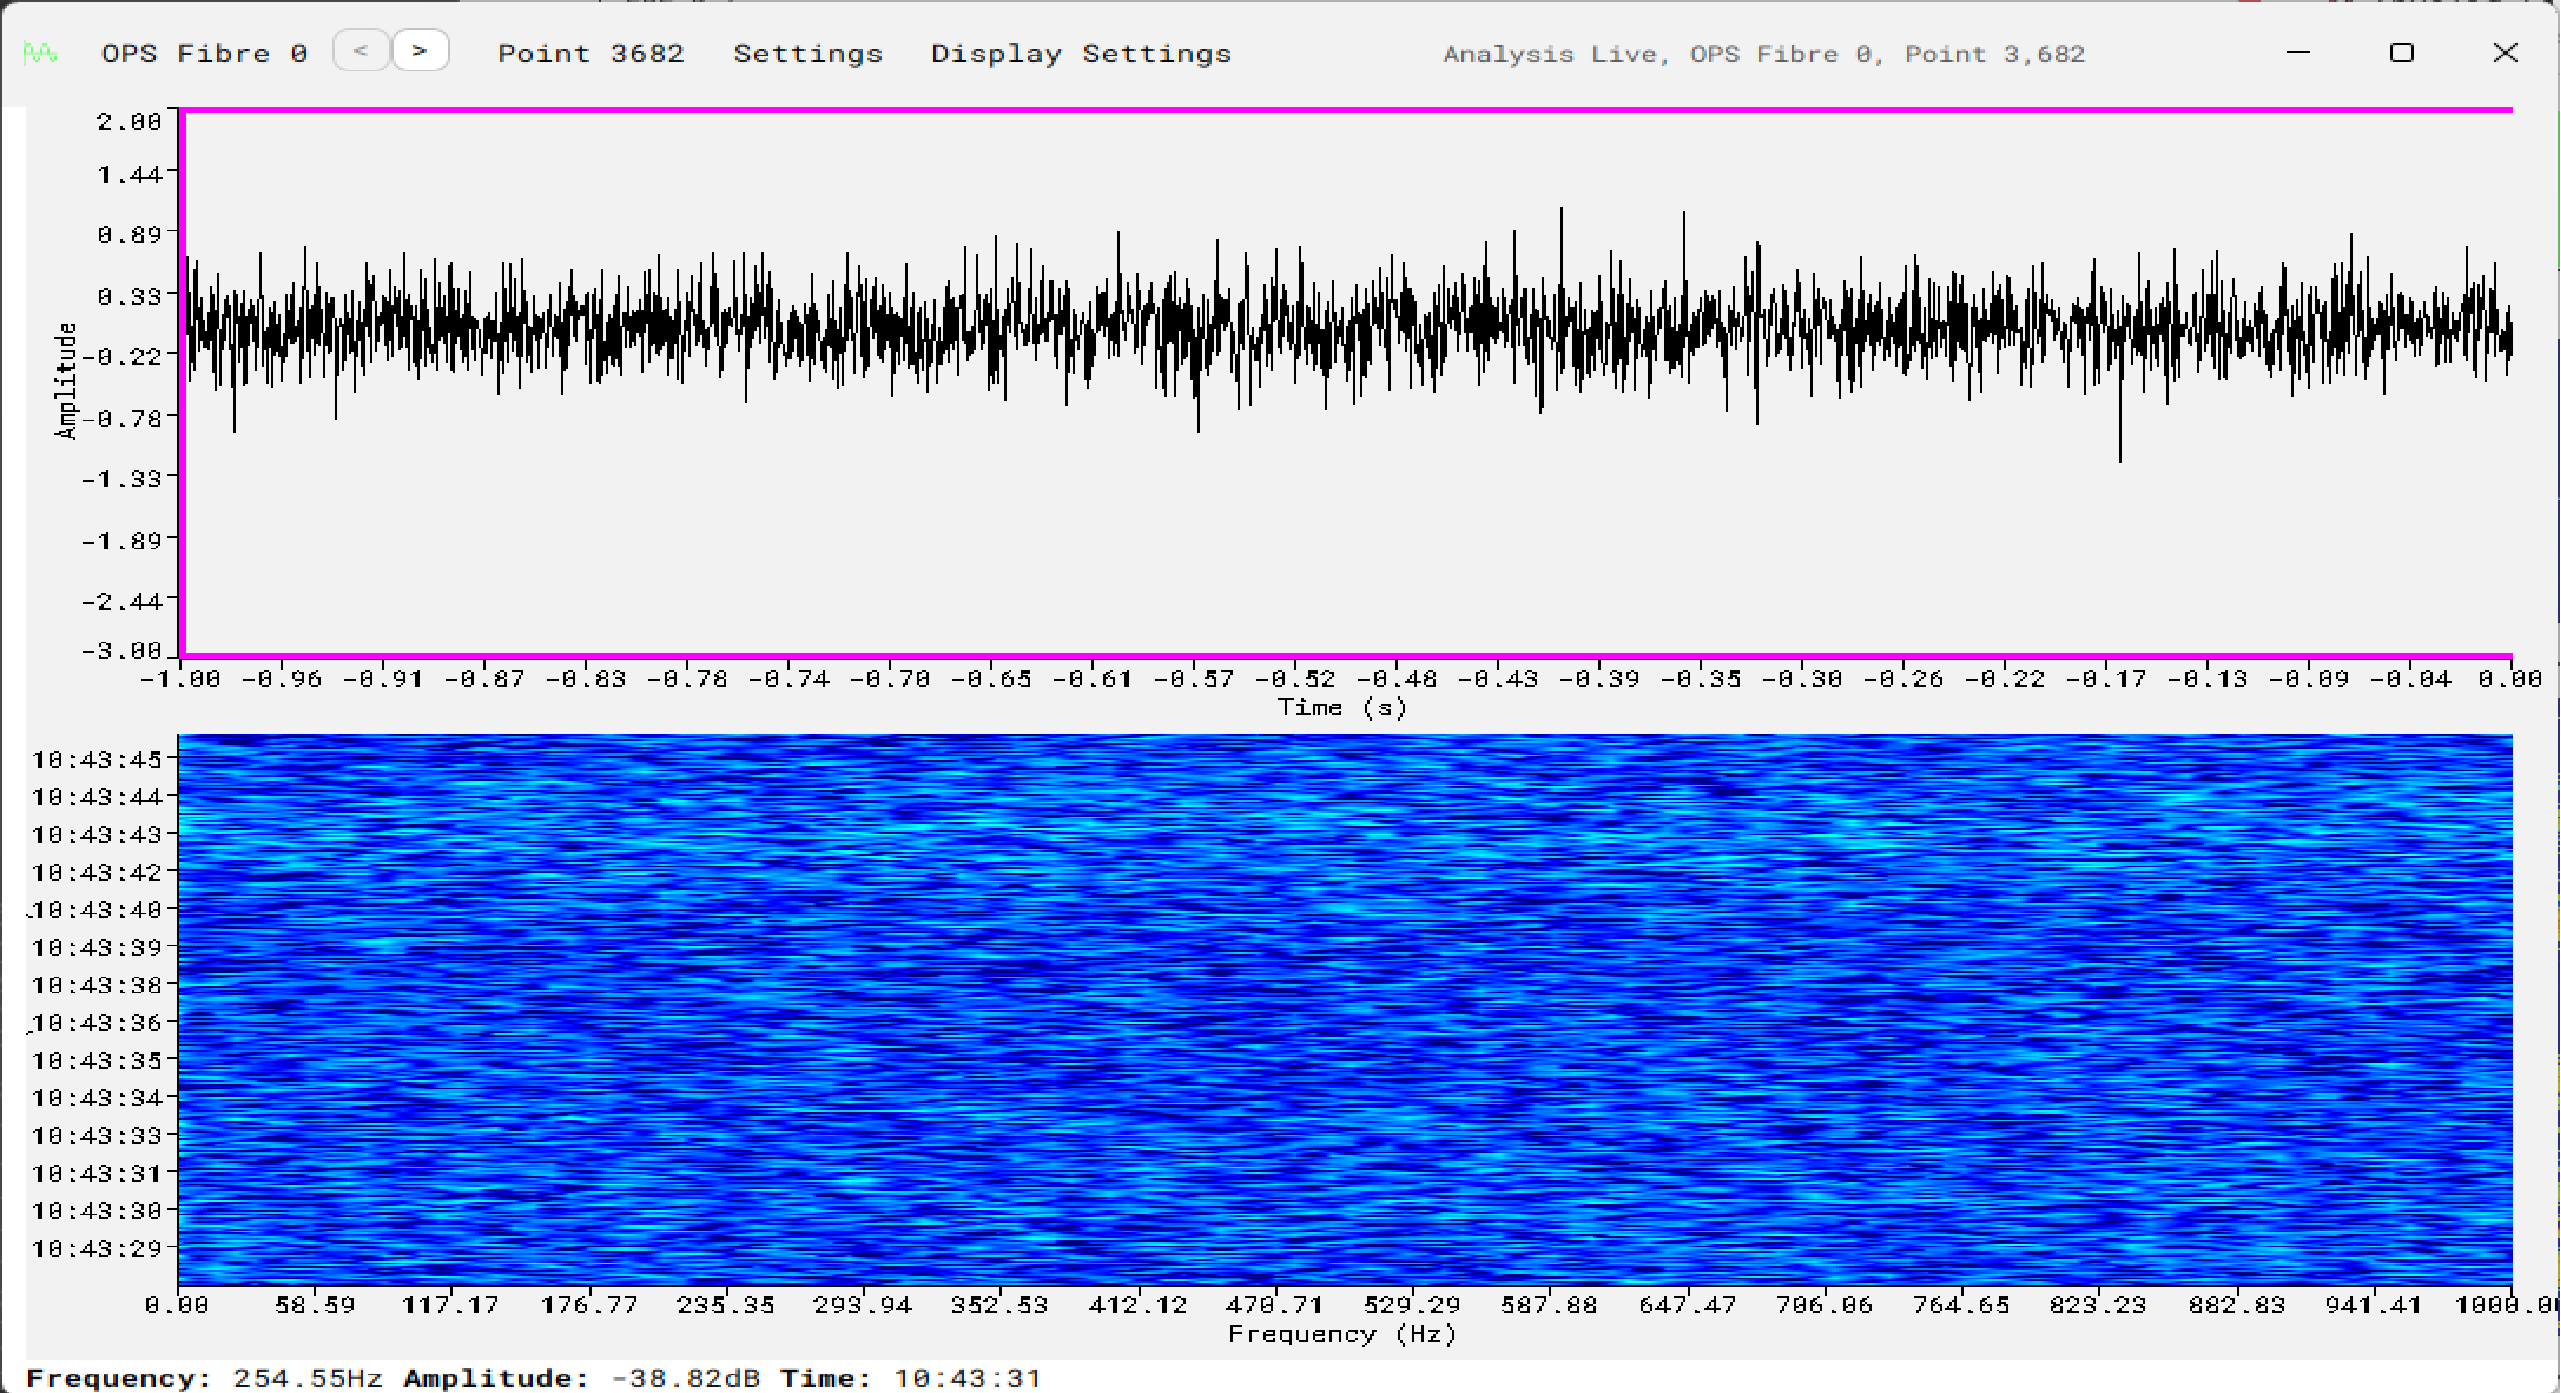
Live Analysis Window
It is possible to select a specific location on the fibre and view the assocaited Time-Series data. This Tool can be used for a number of scenarios such as:
- investigating an activity being displayed on the Live Waterfall Display
- investigting an OS6 Alert
- Assisting in tuning a specific Detector for a known activity
This tool can be accessed by 'right-clicking' on the Map, Waterfall at a specific location or selecting an OS6 Alert and 'right-clicking'
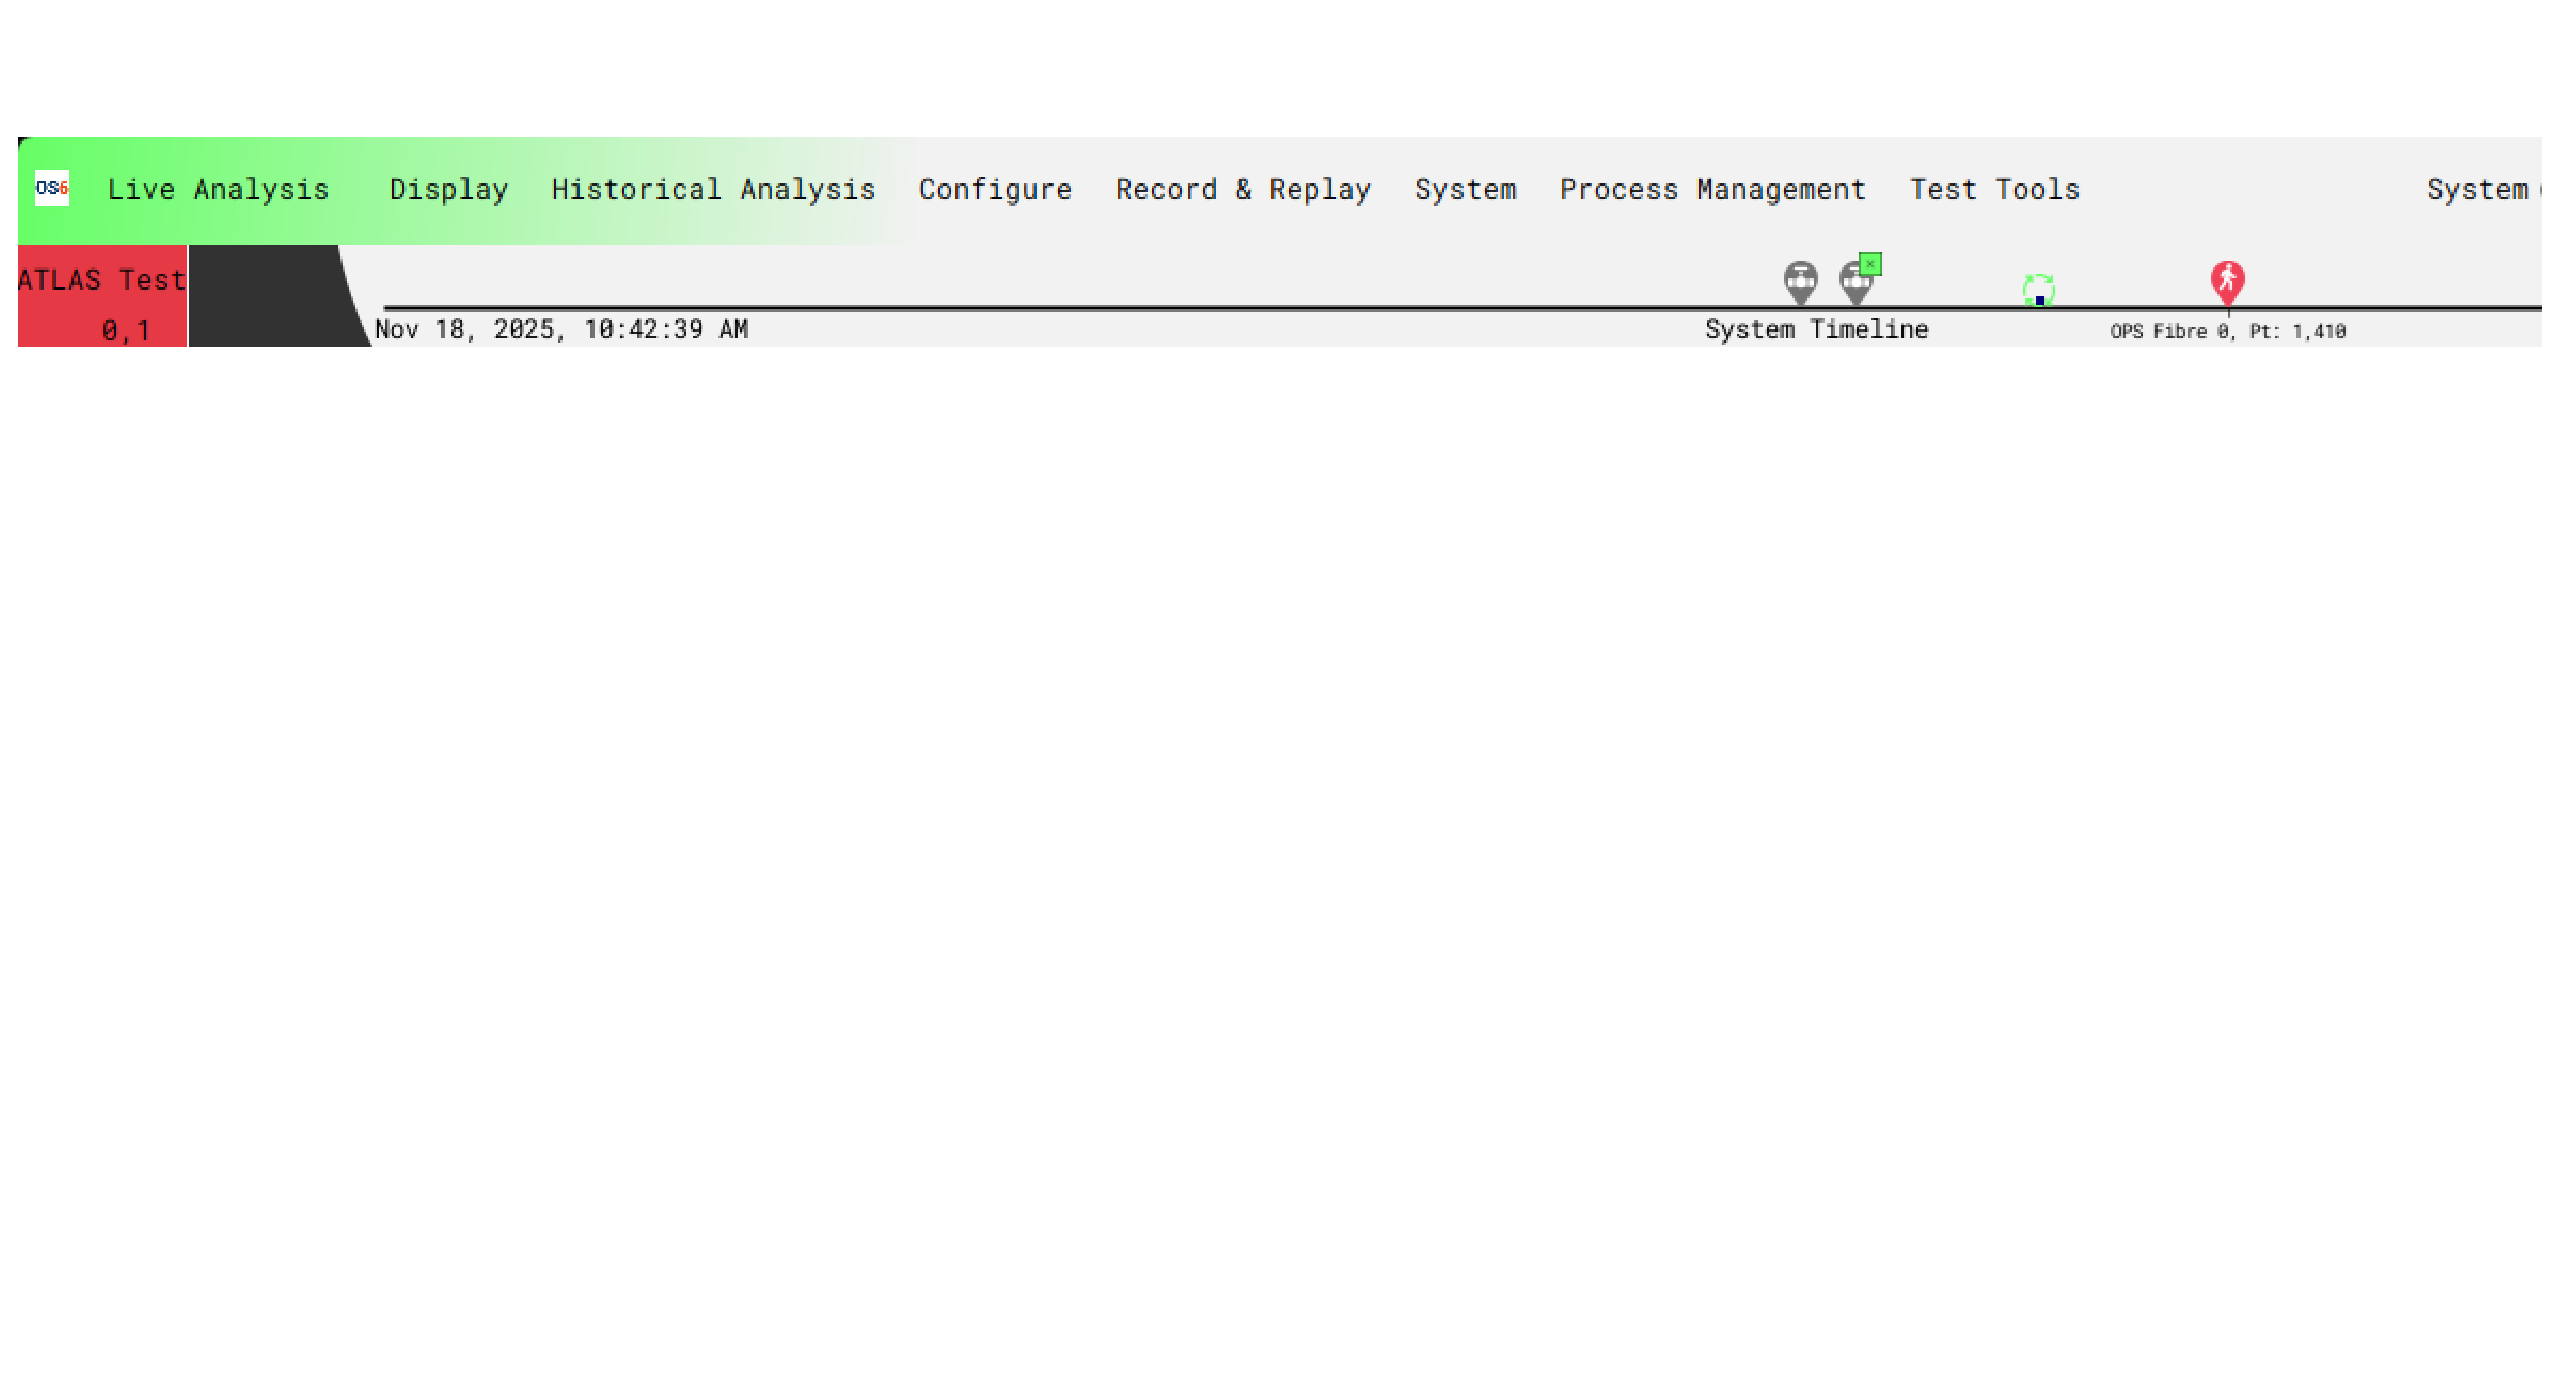
System Timeline
As various actions occur on the OS6 System such as:
- new/updated Alerts
- Processes are start/stopped
The System Timeline at the top of the Map displayed is updated accordingly with these actions (for the last 5 mintes). It is possible to 'right-click' on the associated icon for dfurther details.
Suppression
There are three suppression methods that can be applied to the system to control how it reacts when faced with the following alert scenario.
Zonal Suppression
Zones can be applied to control what alerts are allowed at different locations. For example, a generator within a secure compound is producing a signal like manual digging and a zone is applied to this area to prevent digging alerts from being produced at this location. This type of suppression is best suited to temporary noise sources or those that require time-based suppression. For permanent suppession it is best to do this within the detector itself.
There are 2 ways a zone can be created.
- From the detector suppression configuration panel, select Add Via Map. A prompt will appear instructing the user to draw an area on the map.
- The second way is to select Add from the detector suppression configuration panel.
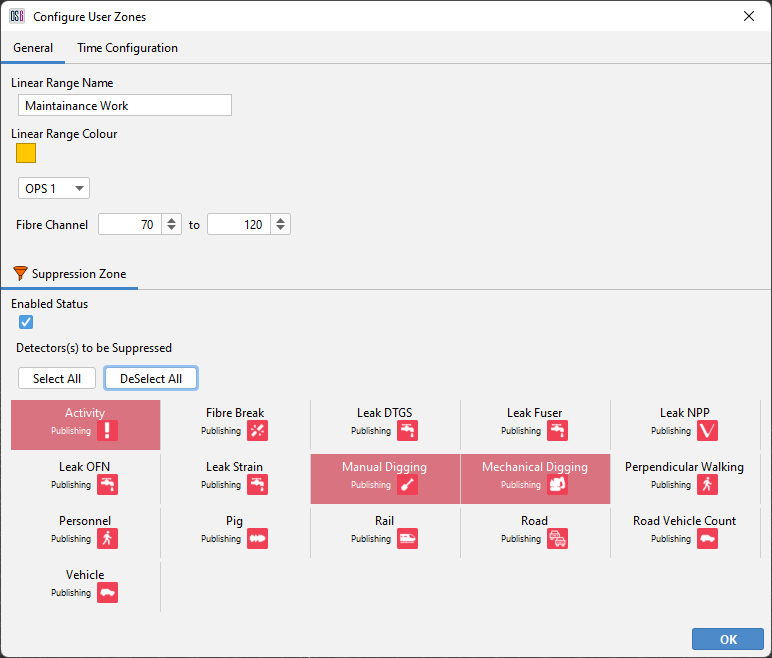
After creating the area, a window dialog allows configuration of what detector instances will be suppressed. By default, all instances will be selected. Deselect any detectors that don't need to be suppressed. Notice below, the channel range, OPS number and colour representing the zone can be edited. Select apply to make the zone active.
Periodic Time Options
Linear ranges can be setup to become active or inactive at certain times/dates using Periodic Times. Periodic Time options are applied per attribute, however only the ‘Zone Suppression’ attribute is supported currently. Below highlights the options available:
- Expiry - Set the attribute to become active/inactive when an expiry time has been reached.
- Time Range - Set the attribute to become active/inactive per day, within a time range (hour/min precision).
- Month Based - Set the attribute to become active/inactive for certain months out of the year.
- Days of The Week - Set the attribute to become active/inactive for certain days throughout each week.
- Hour-based - Set the attribute to become active/inactive for certain hours throughout the day
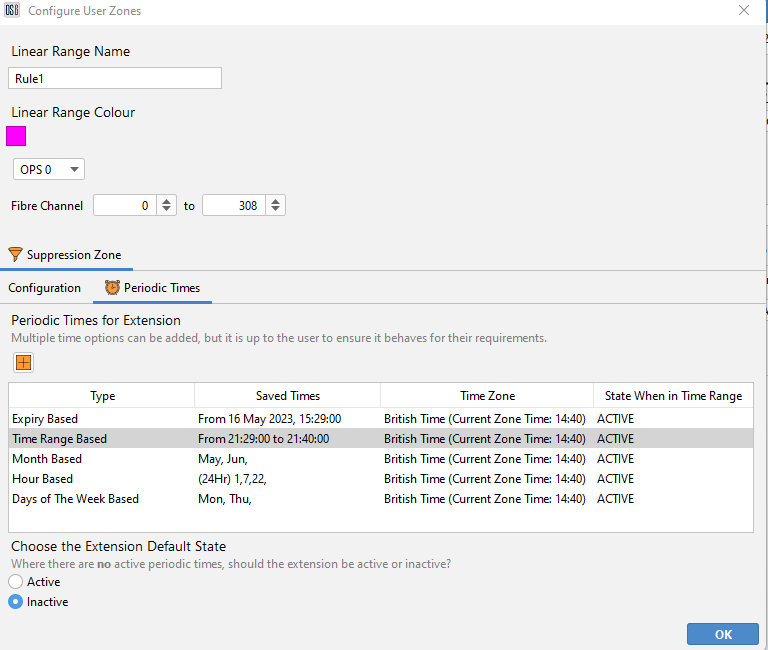
Multiple options can be added but the behaviour should be tested to ensure the rules apply as intended. Periodic Times do not need to be adjusted for daylight savings.
Detector Suppression
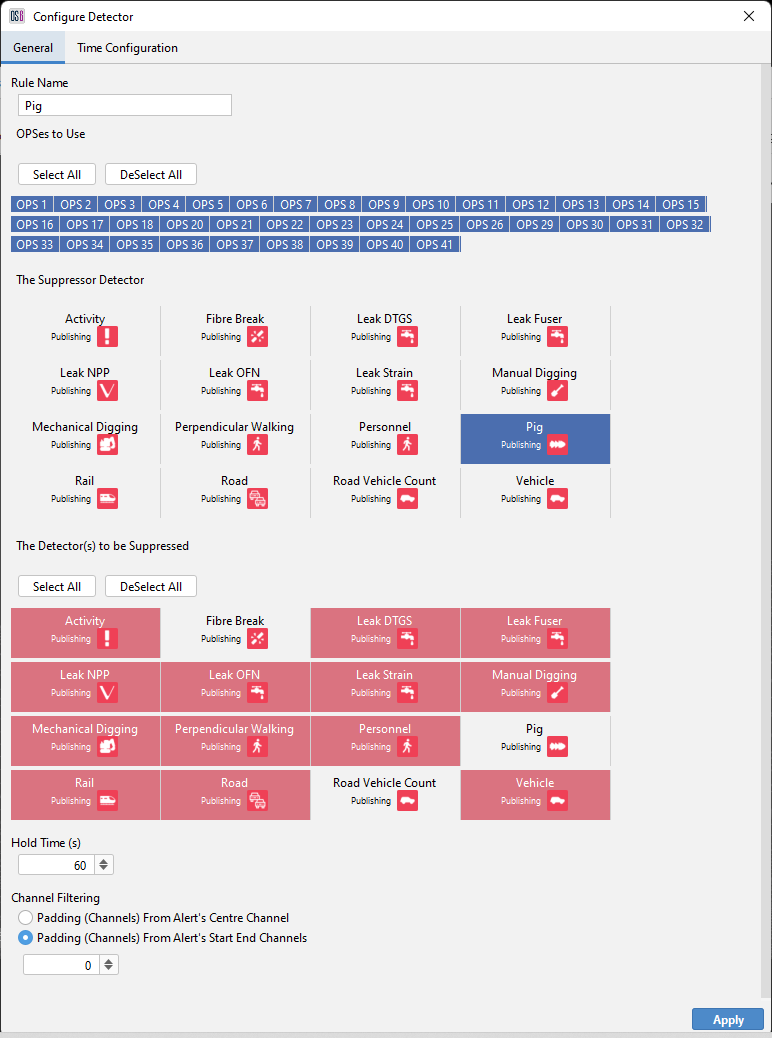
A detector suppression rule can be applied to allow a generated alert to override (or suppress) other alerts that may be created by the same signal source. For example, a PIG is running through the pipeline and is generating a similar signal source to NPP. Creating a rule where PIG is the suppressor and NPP is the suppressed, means only PIG alerts will be generated.
To create a rule, Add a new suppression rule from the detector tab.
There are several options the user can use to aid the configuring of the rule.
- Select the OPSes that the rule applies to
- The suppressor detector
- The alerts to be suppressed
- The hold time is the amount of time that each alert will be delayed while the system checks for a suppressor alert. This allows time to detect other events that may trigger a nuisance alert.
- The area that the suppression will apply around a detected alert. Suppression rules can be configured to apply from the start/end channels of the alert or from the current location and a buffer can be applied around each of these options.
OPS Redundancy
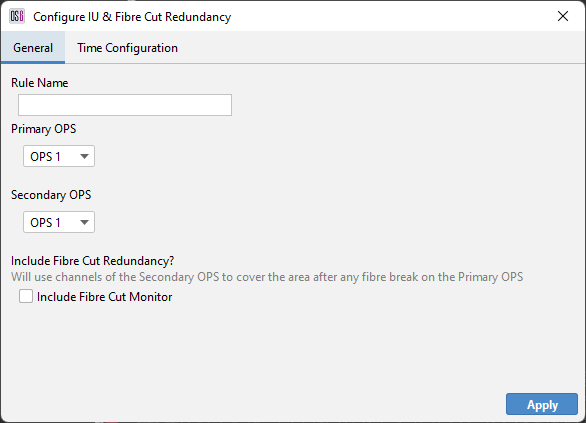
OPS suppression allows redundancy across two separate OPS that are covering the same fibre route with one fibre 'suppressing' alerts on the other unless an issue occurs on all or part of the suppressor OPS.
Suppression Live View
A live view of suppression is provided to allow real-time visualisation of the effects of a suppression rule. This is largely in place for system configuration testing and can be enabled by switching the suppression panel from edit to live.
Linear Ranges
It is possible to create a range of channels and associate one or more attributes to it:
- Zone Suppression
- Alert Tags
- Waterfall Frequencies
- Camera Areas
Zone Suppression
For details, please see Zonal Suppression
Alert Tags
A continuous set of fibre channels can be assigned to have a named ‘Alert Tag’. Any alert created within this channel range will have the Alert Tag added to its alert details. This can then be used by the oeprator or a 3rd Party System to identify this location.

In the above example, the ‘Entry Gate’ to a perimeter covers points 30 to 60. Any Alerts created within these points will have ‘Entry Gate’ as the Alert Tag within the Alert Details
Waterfall Frequencies
The area can be assigned to use a different frequency band for the waterfall display. These frequencies only affect the waterfall display and the recorded histogram data. This can be used to improve the waterfall visualisation in areas with different levels of background signal.
Area of Interest
The area of interest feature provides the ability to view all generated alerts within a specified area and time period. This feature will display all alerts in a summarised fashion irrespective of whether they were acknowledged or dismissed.
Select Add to choose between drawing the area by channel range or K point. Now draw the required area on the map and when prompted name it appropriately.
Multiple areas can be created, and their conditions edited at any time. Select Edit to change the following setting.
- Duration: is the amount of days the system will retain alerts.
- Start / End OPS: enable the area to span over two OPS's.
- Remove: will delete a selected area.
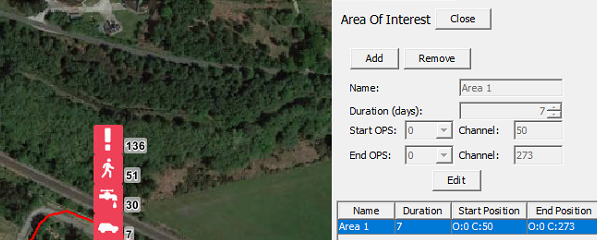
Areas of Interest can be toggled on and off from the map display.
Complex Routes
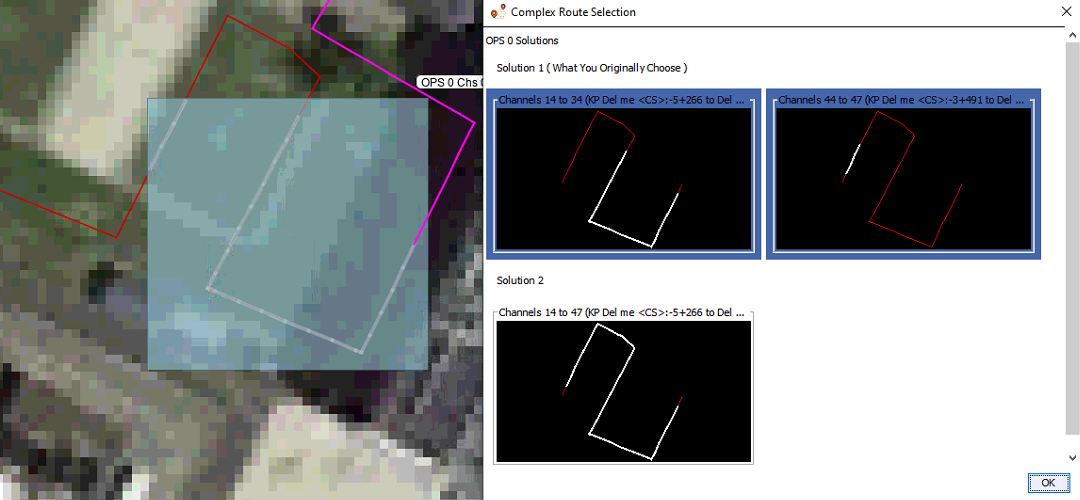
Complex routes allow the user to choose the exact area of fibre they want to apply a zone or suppression area to. This is useful when dealing with lengths of fibre that pass over each another, loop back on themselves or are connected to separate OPS's. When using complex routes, the software detects the exact OPS channels of the fibre, shown as 'Solution 1' and if possible, offers multiple solutions as seen in the image below.
Historical Analysis
Historical Alerts
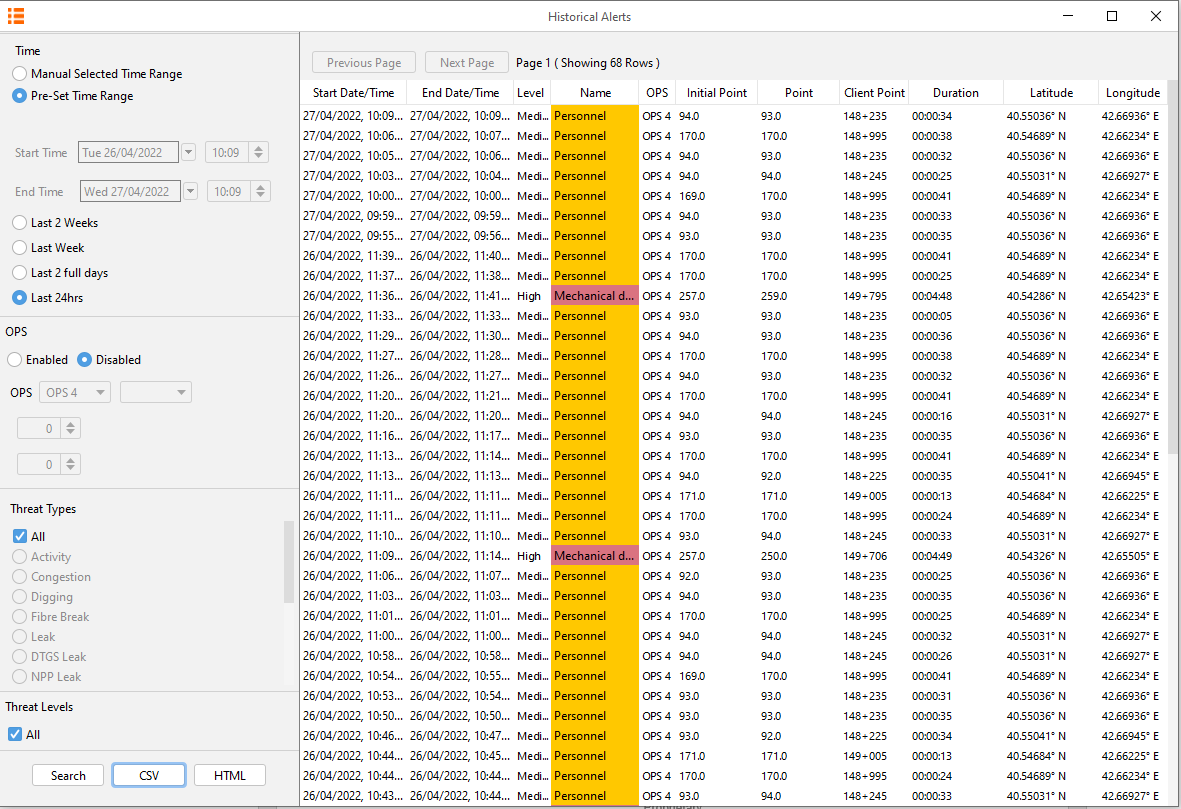
OS6 provide a search tool to list the Alerts that have been created. Various filters include:
- Start/End Time
- Start/End Location
- Alert Type
- Alert level
These alerts can then be exported into a chart or CSV format.
HTML Report
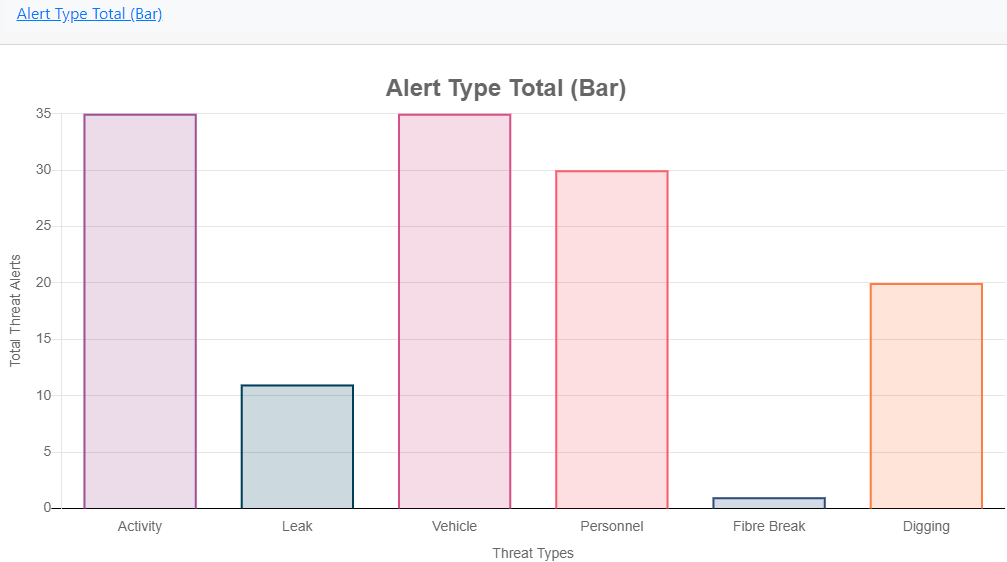
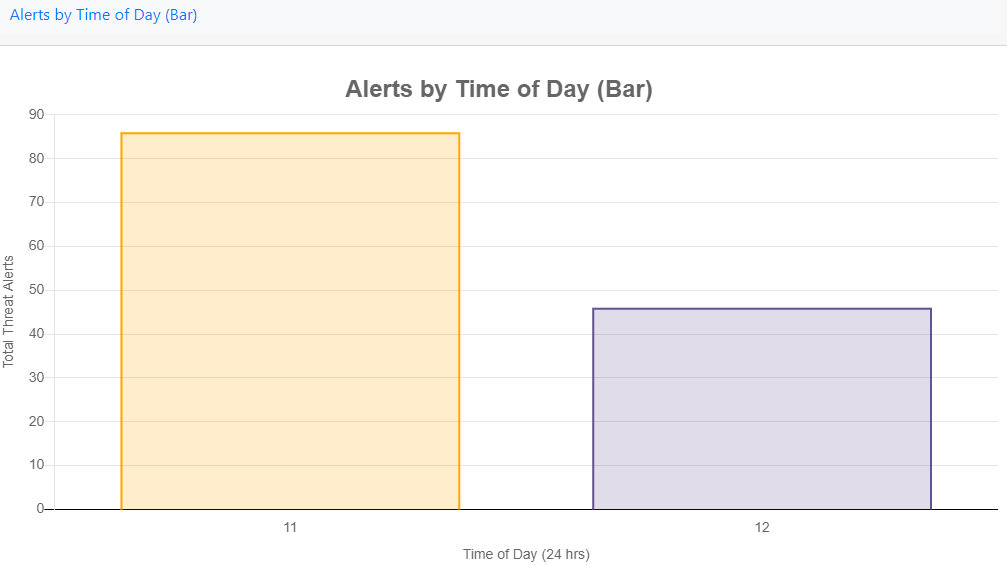
Historical alert data exported to a HTML report provides charts revealing trends within the alert such as the total number of each type of alert. The different charts available are listed below.
Alert Charts
There are three tabs on the top left of the browser.
- Charts - Displays a list of charts
- Waterfall - Provides a histogram waterfall based on the duration selected in the alert search query.
- View - Selecting Default will change the view mode to extended. This provides increased viewing focus on charts. Theme: Changes the white borders of the webpage to grey.
(Example) Chart Types
Alert Type Total (Bar)
Alerts by Time of Day (Bar)
Historical Waterfall
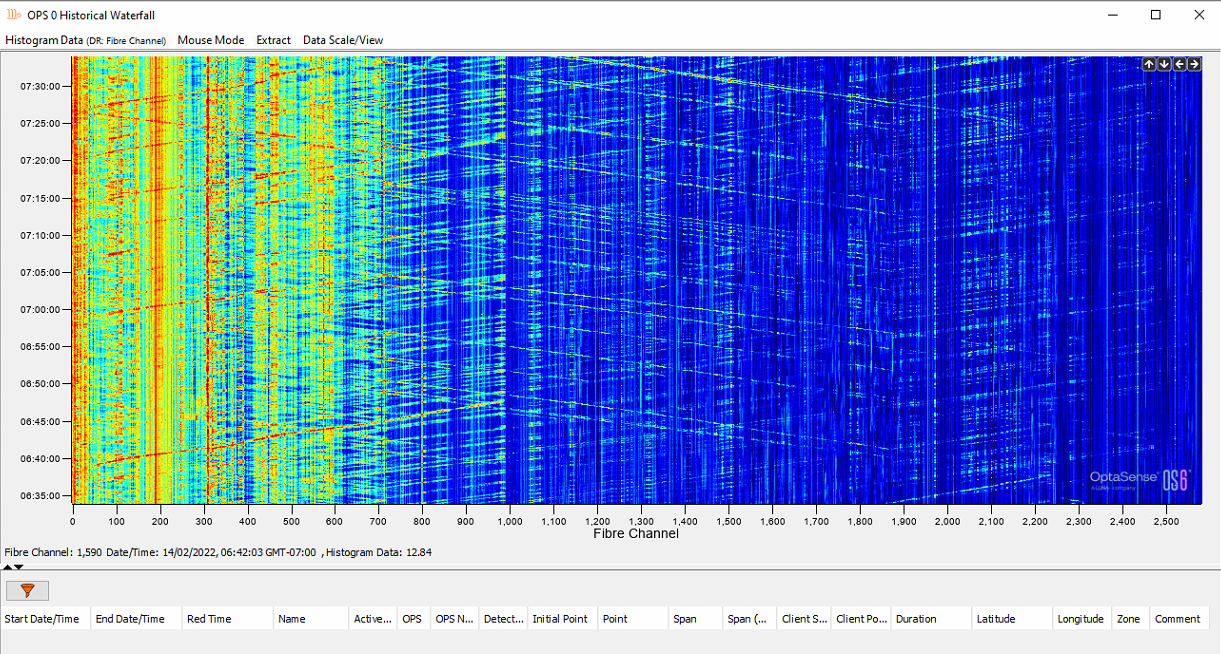
The alert history waterfall enables the visualisation of historic data. This can be accessed by typing 'Historic Waterfall Data' or from the toolbar, select the Alert History Waterfall button from the Historical Analysis tab.
The dialog box shown will appear where the desired OPS, date/time and channel range can be specified. The data source can also be changed to retrieve data from other rolling recorders. The search function is limited to a 24 hours period.
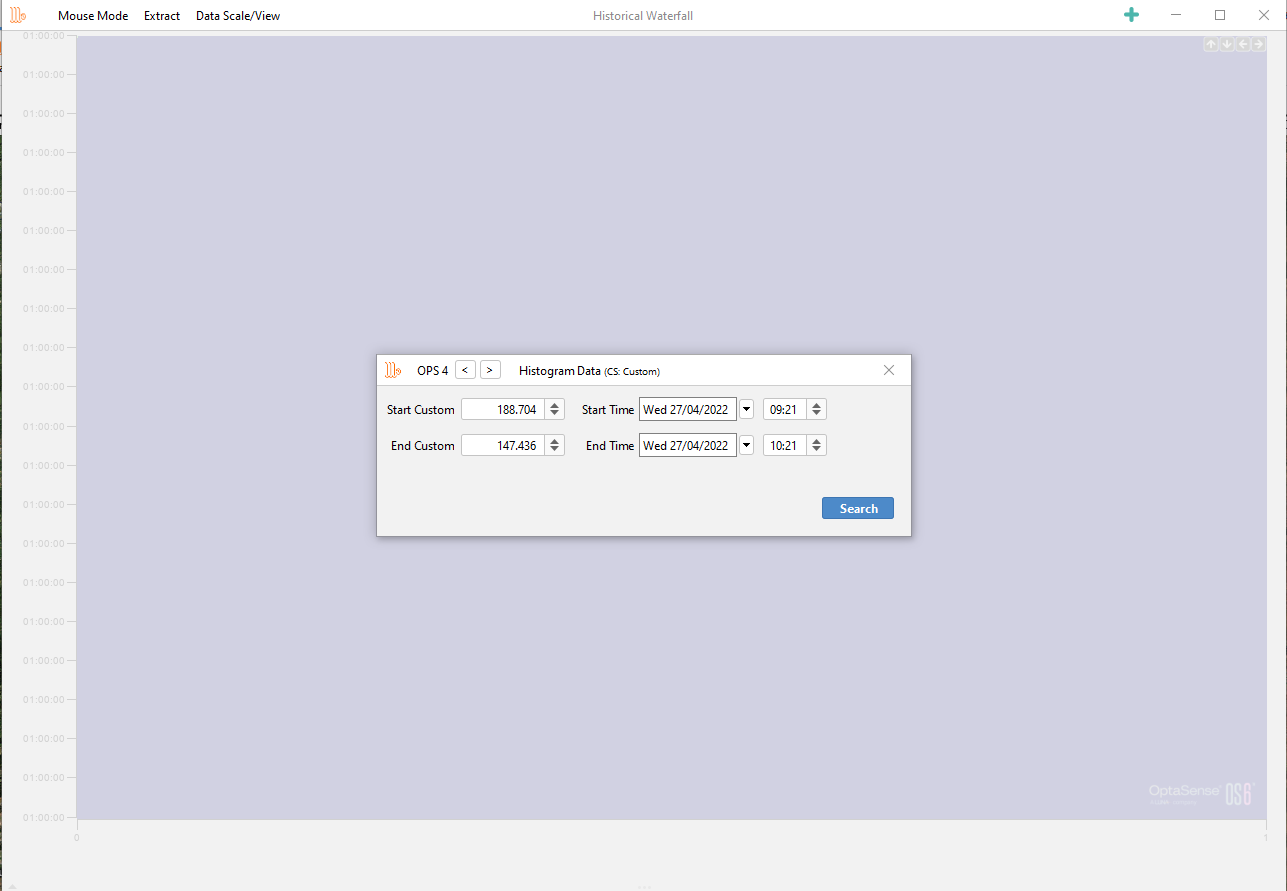
Assuming the data is available, a snapshot of the data and any associated alerts from within the time span will appear.
Extracting Data
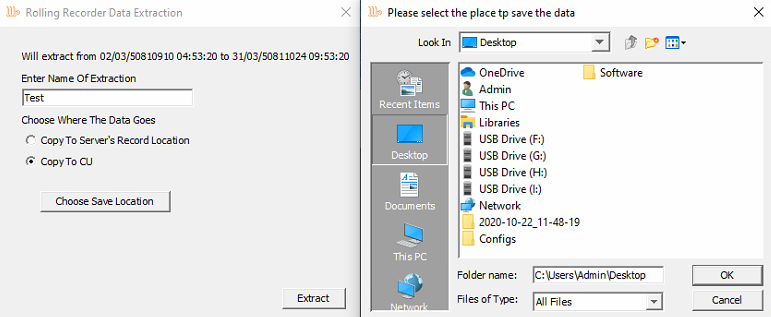
Data can be extracted from each of the rolling recorders as raw data or to CSV as required. Sensor data can require large amounts of space and the overall file size is limited.

Name the data accordingly and choose between copying to Server's Record Location or Copy to CU. When copying to CU, the user will be prompted to choose a storage location.
Multi-Point Trending
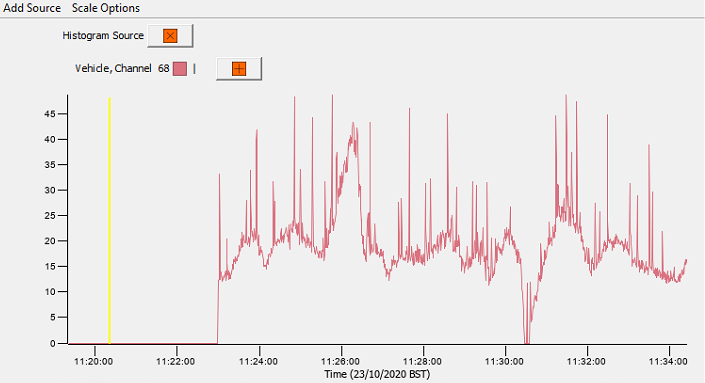
The multi-point trending tool enables the user to plot historic data recorded on the system as a time series plot. Data can be plotted directly from an alert or by adding data sources within the tool.
Audit
The audit tool allows the user to review any system changes that have occurred within the requested timeframe.
- Items that can be searched on, include:
- Detector changes
- System/Process changes
- Alert Lifecycle changes (comments, acknowledgement etc)
- User Account changes (login, changes to an account, account deletion)
- Suppression Changes
The Audit tool can be accessed from the Historical Analysis menu.
The configuration panel on the left allows the user to control the scope of the audit.
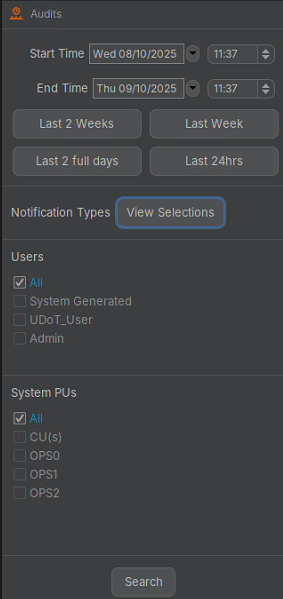
To change what actions are to be listed, select View Selection as shown in the image above. Uncheck the unrequired actions.

Select search to run the audit. To display more information on a result, hover over. To quick filter, use the search box and type the name of action / user as required. The column headers can also be used to filter through a right-click context menu.
Audits can be exported to CSV.
Audit Trail
Within the audit tool, audit trails/linked audits can also be viewed on the right-hand side. Audits that are linked normally share a characteristic like an identifier or name so that the change history for that link can be seen overtime. An example of this is viewing the audit trail for an alert to see when it was created, updated, and acknowledged etc., or to see the change history of a Detector setting.

It is also possible to view the audit trail for an event by using the 'View Audit Trail' option available in the right-click context menus. This option will open a display in which the audit trail will show for the selected event.
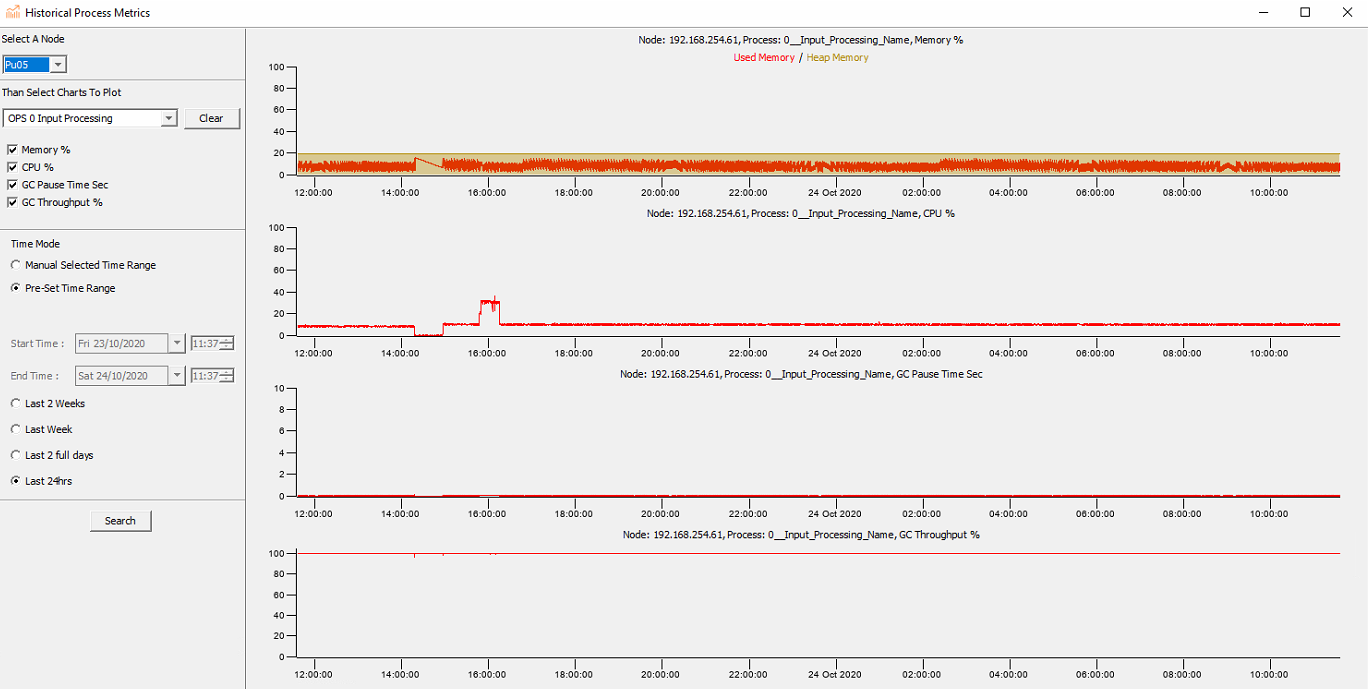
Process Metrics
The Process Metrics tool allows the user to review the resouces used by a specific process on a specific Processing Unit. Various resources are stored for a number of days, such as:
- CPU loading
- Memory loading
This could assist in undersndaing issues when a particular OS6 Service/Processing Node is having issues such as high loading.
System Health/Process Management
Overview
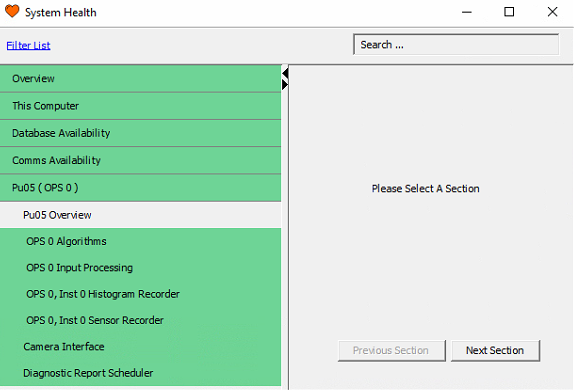
System Health provides the health state of the major processes and interfaces running on the system. To access this window, select System Health from the Process Management tab on the toolbar.
-
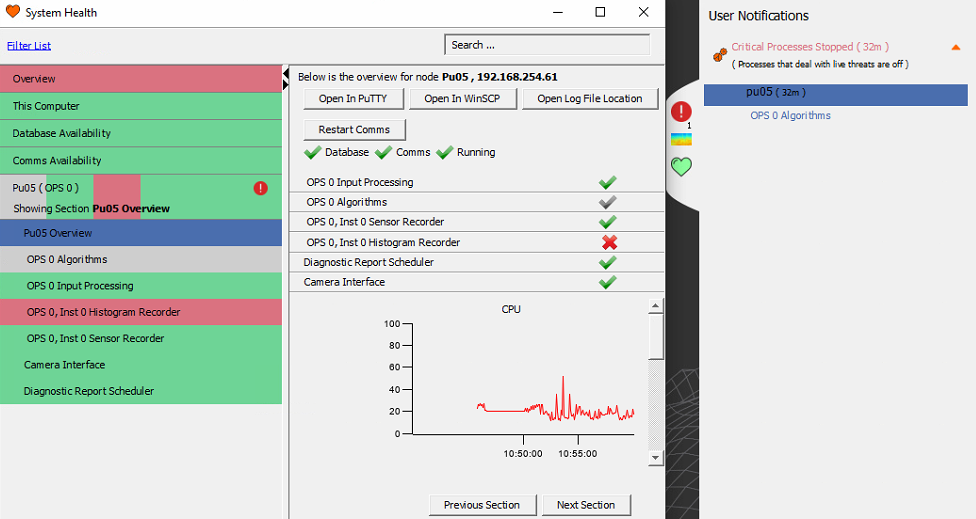
Processes that are running without issue will be highlighted in green
-
Processes that have been intentionally disabled will be highlighted in grey
-
Any processes that are in an error state will be highlighted red.
-
A user notification will occur if a process enters an error state. Below, the histogram recorder can be seen to have entered an error state as a result of the Algorithms process being stopped.
- The user notification can be expanded to provide further details about why an error has occurred.
Stopping, Starting Processes
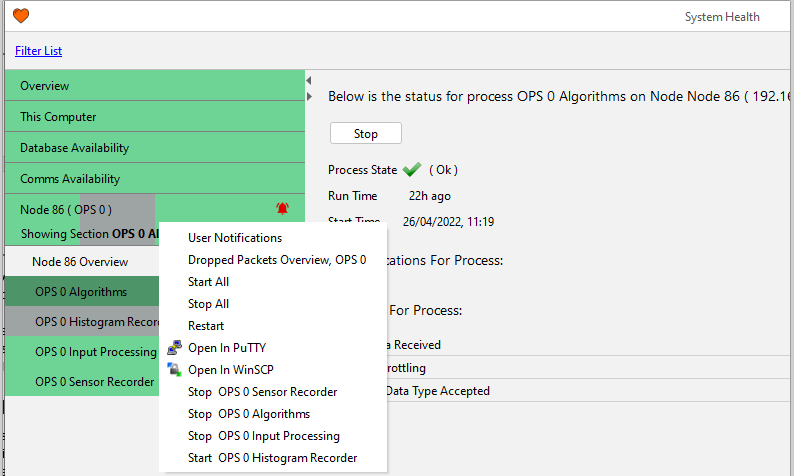
All process can be stopped/started via System Health and selecting 'Overview'
It is possible to stop/start processes on a per node basis. This can be achieved by opening the System Health display and selecting a node. All processes for this node can be stopped/started. Below showcases the ways processes can be turned off and on from System Health.
Node Status Overview
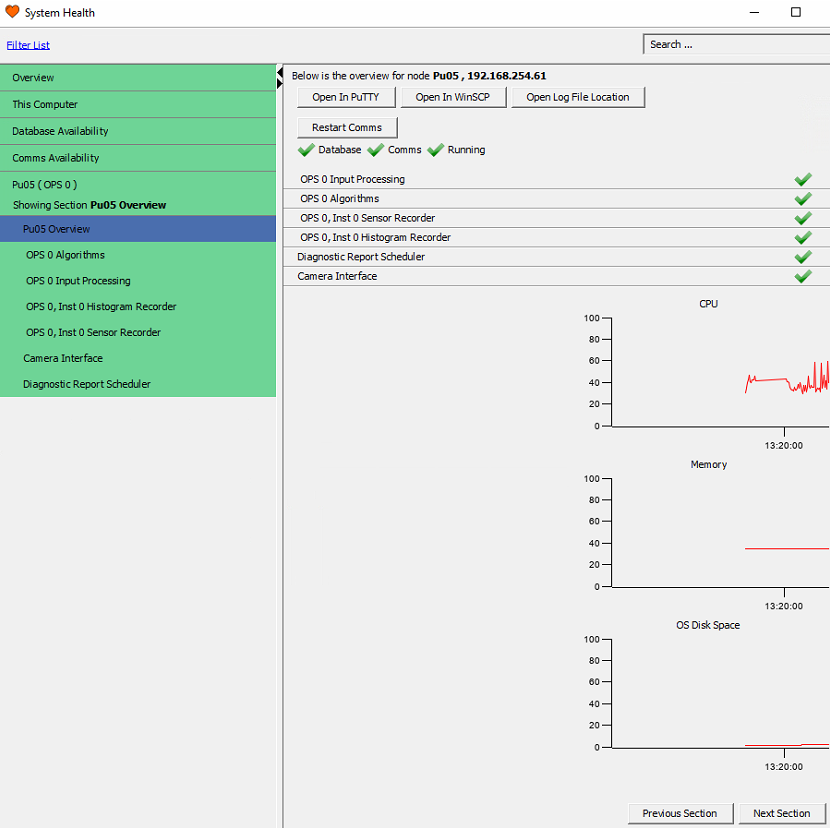
The status overview page displays each processing server (Node) and the status of the processes running on it. To reveal these, click on the required node. Each process can be stopped and restarted in two ways.
-
Right-click on the process and select Stop / Start.
-
Select the process, then Stop / Start from the central window.
Restart Processes Button Overview
For each node, there are several action buttons:
- Open in PuTTY - 3rd Party Utility that provides console access to Linux on the node.
- Open in WinSCP - 3rd Party Utility that provides Linux GUI folder and file navigation on the node.
- Open Log File Location - Displays log files for the node.
- Restart Comms - Restarts Hazelcast on the node.
Database & Comms Availability
This section provides the connection state of the node comms and the distributed database for the system.

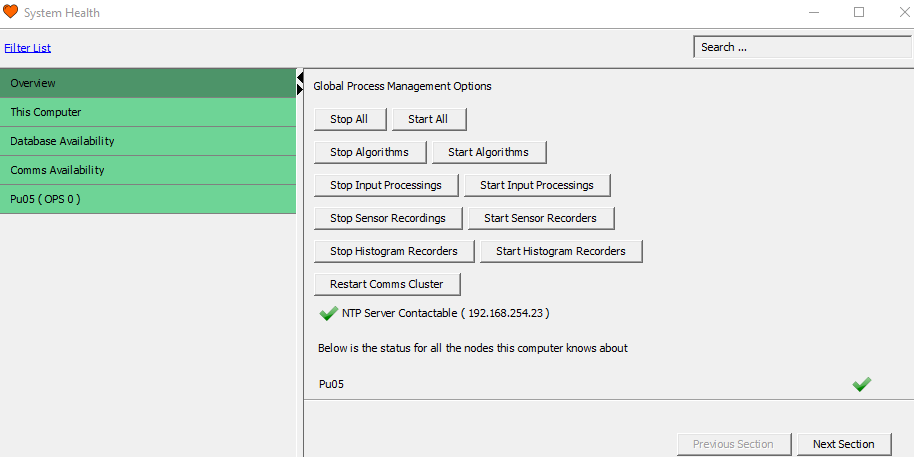
Global Process Management
Global Process Management enables the user to stop and start important processes collectively across the system. The following list describes those processes.
Restart Processes Button Overview
- Stop / Start All – Restarts all-important processes listed in the System Health.
- Stop / Start Algorithms – Restarts detector algorithm processes.
- Stop / Start Input Processing – Restarts the data stream process from the IUs to the algorithms.
- Stop / Start Sensor Recordings – Restarts the sensor recordings processes.
- Stop / Start Histogram Recordings – Restarts the histogram recordings processes.
- Restart Comms Cluster – Restarts the communication process across all nodes.
Support artefacts
Location of logs
All the IU and processor node logs are located on the server node. All the information is present in the System Health feature and the logs can be accessed from there.
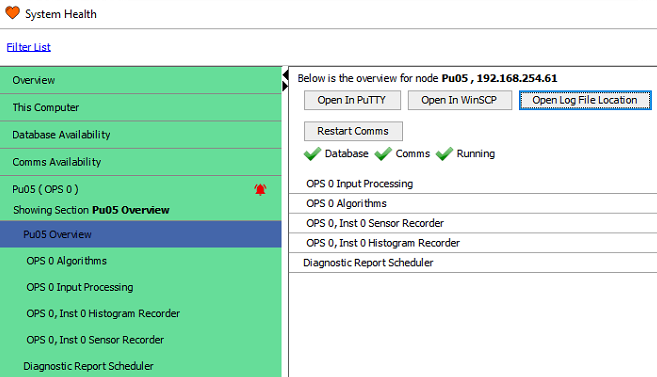
Additionally, this can be configured and accessed via a mapped network drive.
Location of the CU logs
The CU logs are located on the CU and can be access by pressing F9 from the main OS6 GUI. Windows explorer will automatically open at the log location.
The full address of the logs is C:\Users\Admin\AppData\Local\OptaSense\OLA6. However, this needs to be typed into the windows explorer toolbar as the folder is hidden so can't be found by just navigating to it.
Location of Windows Background tasks logs
Additional tasks are run in the background on the CUs. The location of these logs are on the CU is C:\Windows\System32\config\systemprofile\AppData\Local\OptaSense\OLA6
Location of Database logs
Each node has an instance of Cassandra Database running on it. The associated logs can be found on the server node at /var/log/cassandra/system.log. To view these logs, it is recommended to use ‘Putty’ or ‘WinSCP’.
Generating a ticket
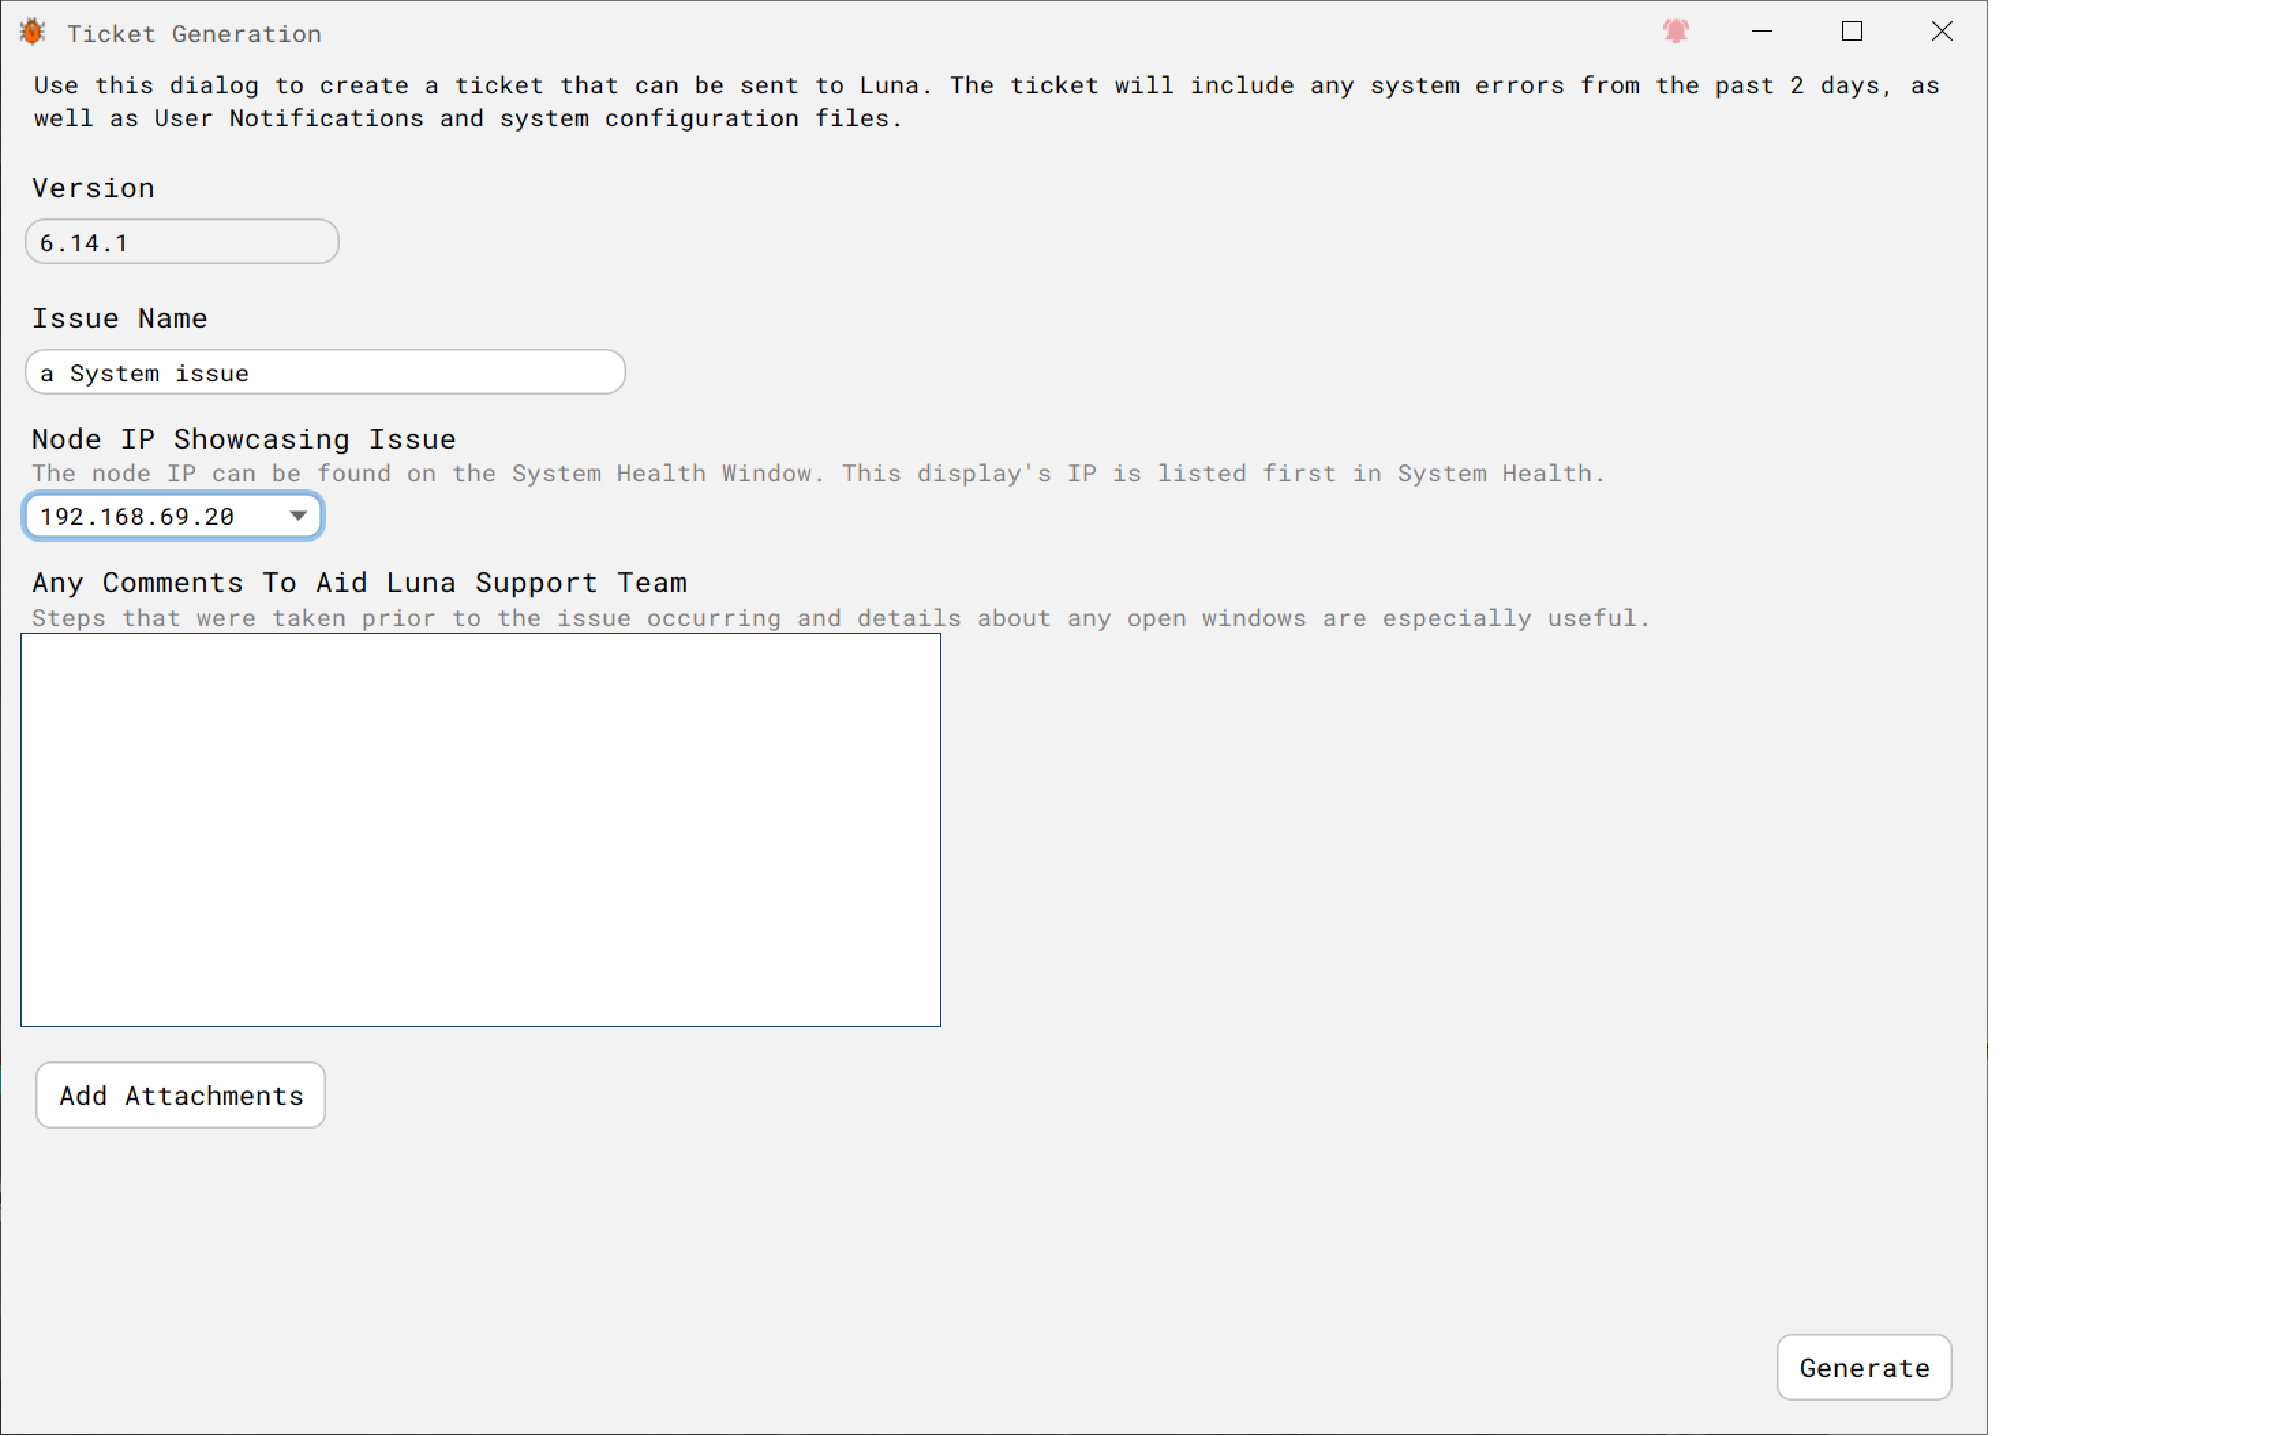
In an event of a System failure, it is possible to create an OS6 'Ticket'. The associated diaglo can be opened by typing 'issue' It allows the operator to enter details of the issue with the following item automatically be stored with the 'Ticket'
- the associated log files
- the configuraton
- Software version
Advanced Items
Record and Replay
Record & Replay allows sensor data to be recorded and replayed later.
Only trained user accounts have access to the Replay feature. Replaying data will stop live data being processed.
Manual Recording
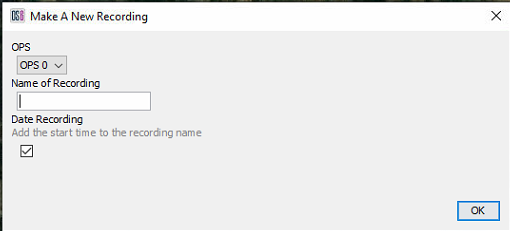
From the main Record & Replay menu, select the required OPS (top left), then Start New Recording. Fill out the required details, for example, the activity and channel number (Man Dig CH2000) and click OK to start the recording. To stop the recording, right-click on the running recording and select stop.
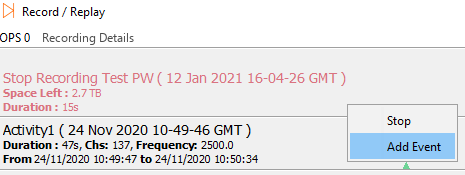
While recording, if an event of interest occurs, notes can be added to the recording to mark the event. Right-click on the recording and select Add Event. Fill out the text field with the required details and select OK.
Replay
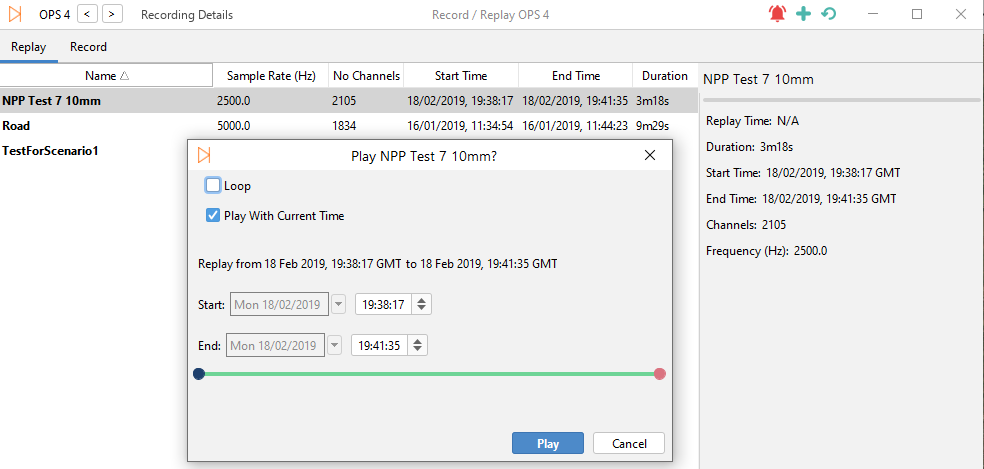
To replay a recording, whilst in the Record & Replay window, right-click of the required recording and select Play. A window will appear where the user can alter the replay parameters:
- Loop – Automatically replay the recording once it's finished
- Play With Current Time – Plays the recording as if it were in real current time. Unchecking it will replay the recording with its original time/date
- Start / End Fields – Enables the start and end time to be edited, which is useful for skipping to certain parts of a recording.
When a replay is running, events can be added by rightclicking on the recording in replay and selecting ‘Add Event’.
Replaying data will replace the live data stream and no live data will be processed.
Manual Record Path
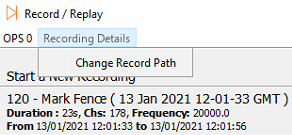
The manual record path, by default, is set to the following location /mnt/disk4/ManualRecordX, where X is the OPS number. Should this path need to be changed, it can be changed from the Recording Details menu.
Dropped Packets
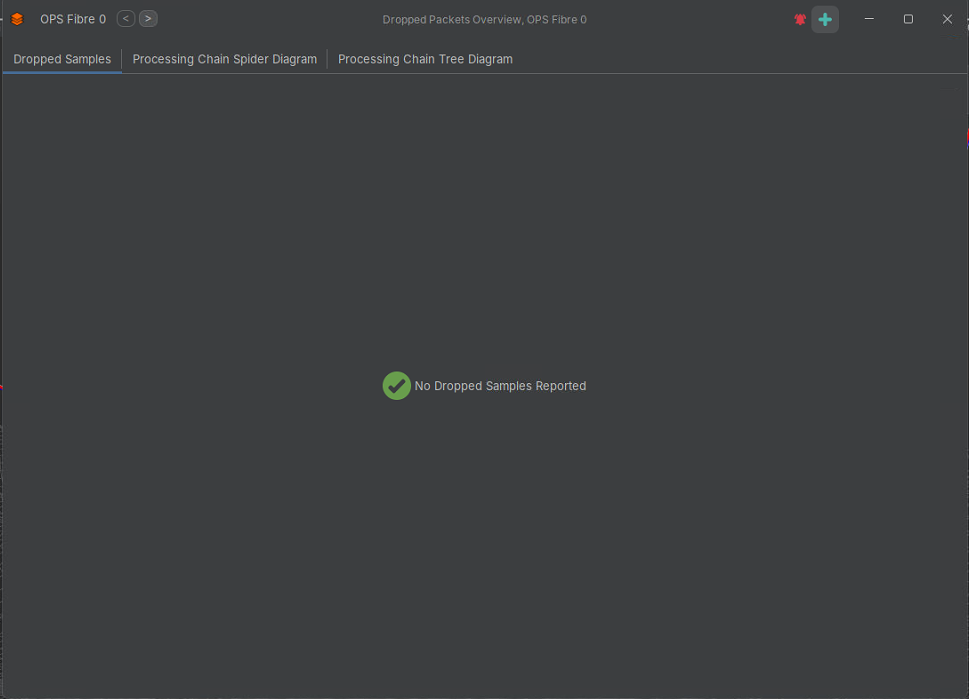
Dropped Packets are an indication that the system is unable to keep up with the data being received. When this happens, an error will appear in the User Notification window. Some examples of causes of drop packets are having too many detectors running simultaneously or if a hard drive is running slowly. If dropped packets are occurring regularly, an investigation into the cause must be undertaken.
Processing Chain Performance
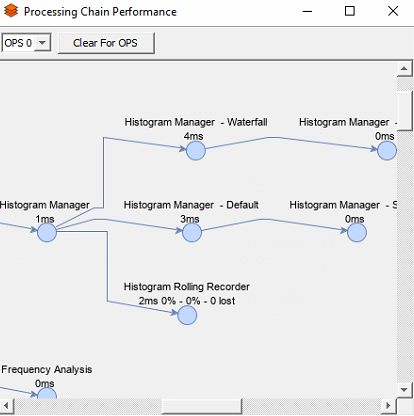
Processing Chain Performance gives a resource overview of all processes running on the system. To access this window, select Processing Performance from the Process Management tab on the toolbar. Values includes:
- The amount of time spent in each processing step
- The current and max watermark levels seen in each of the buffers
- The number of packets that have been lost within a given step
High values can indicate processing strain and packet losses should be investigated.
Support Services
For information regarding support options please contact us through OptaSense Support Services.